
Technographics data benchmark 2026: Crustdata vs BuiltWith vs TheirStack vs Sumble
Last updated October 2026
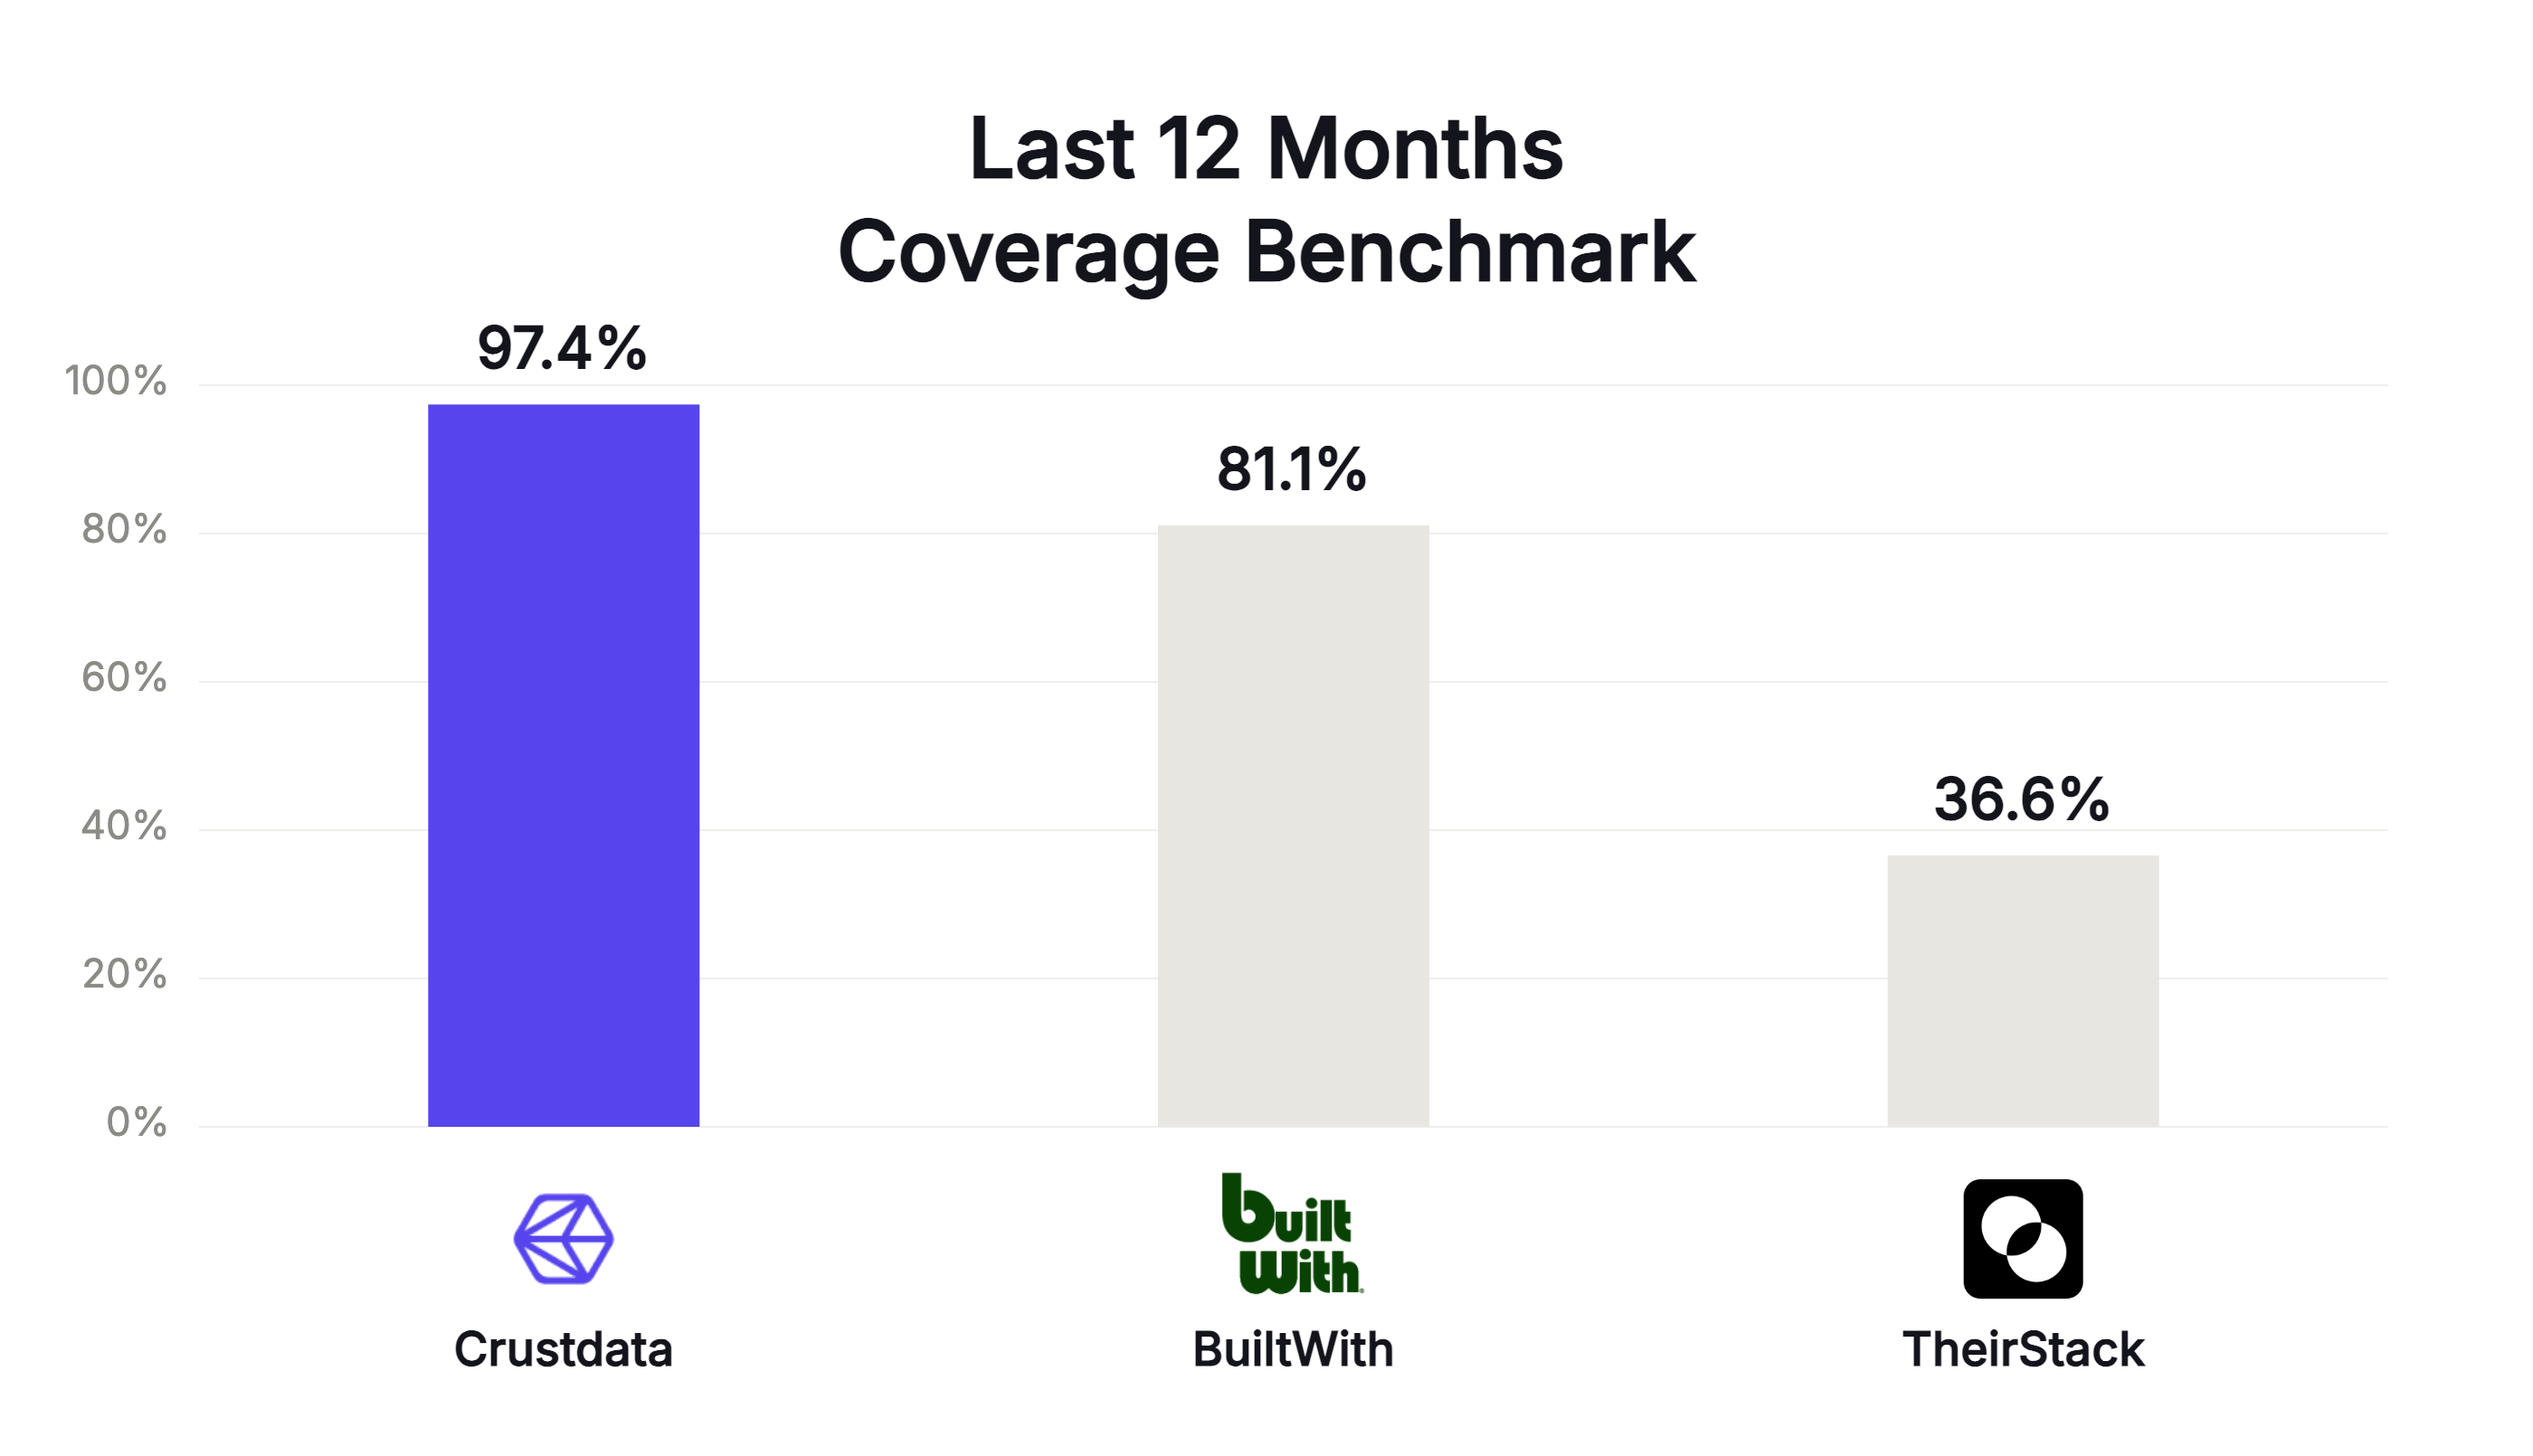
Crustdata returned the most technographics coverage of the four providers tested, finding 86.0% of each company's verified tech stack across 1,004 companies. BuiltWith was second at 72.6%, followed by TheirStack at 50.9% and Sumble at 28.1%. On detections from the last 12 months, Crustdata reached 97.4%, while Sumble returned no dates at all. Every Crustdata detection links back to the job posting or website signal that produced it, which the other three providers do not do.
Technographics coverage is the share of a company's actual tech stack that a provider detects and returns. A provider can report a technology only when one of its sources saw evidence of it, so coverage reflects how widely a provider looks.
tldr:
- Crustdata found 86.0% of each company's verified tech stack across 1,004 companies, the highest of the four providers and over 13 points ahead of BuiltWith at 72.6%.
- On detections from the last 12 months, Crustdata reached 97.4%. Sumble returned no dates, so its recency cannot be checked.
- Every Crustdata detection links to the job posting or website signal behind it. TheirStack and Sumble return the technology with no source.
Which technographics provider has the highest coverage?
Crustdata has the highest coverage, at 86.0% across all 1,004 companies, and it leads in every segment tested.
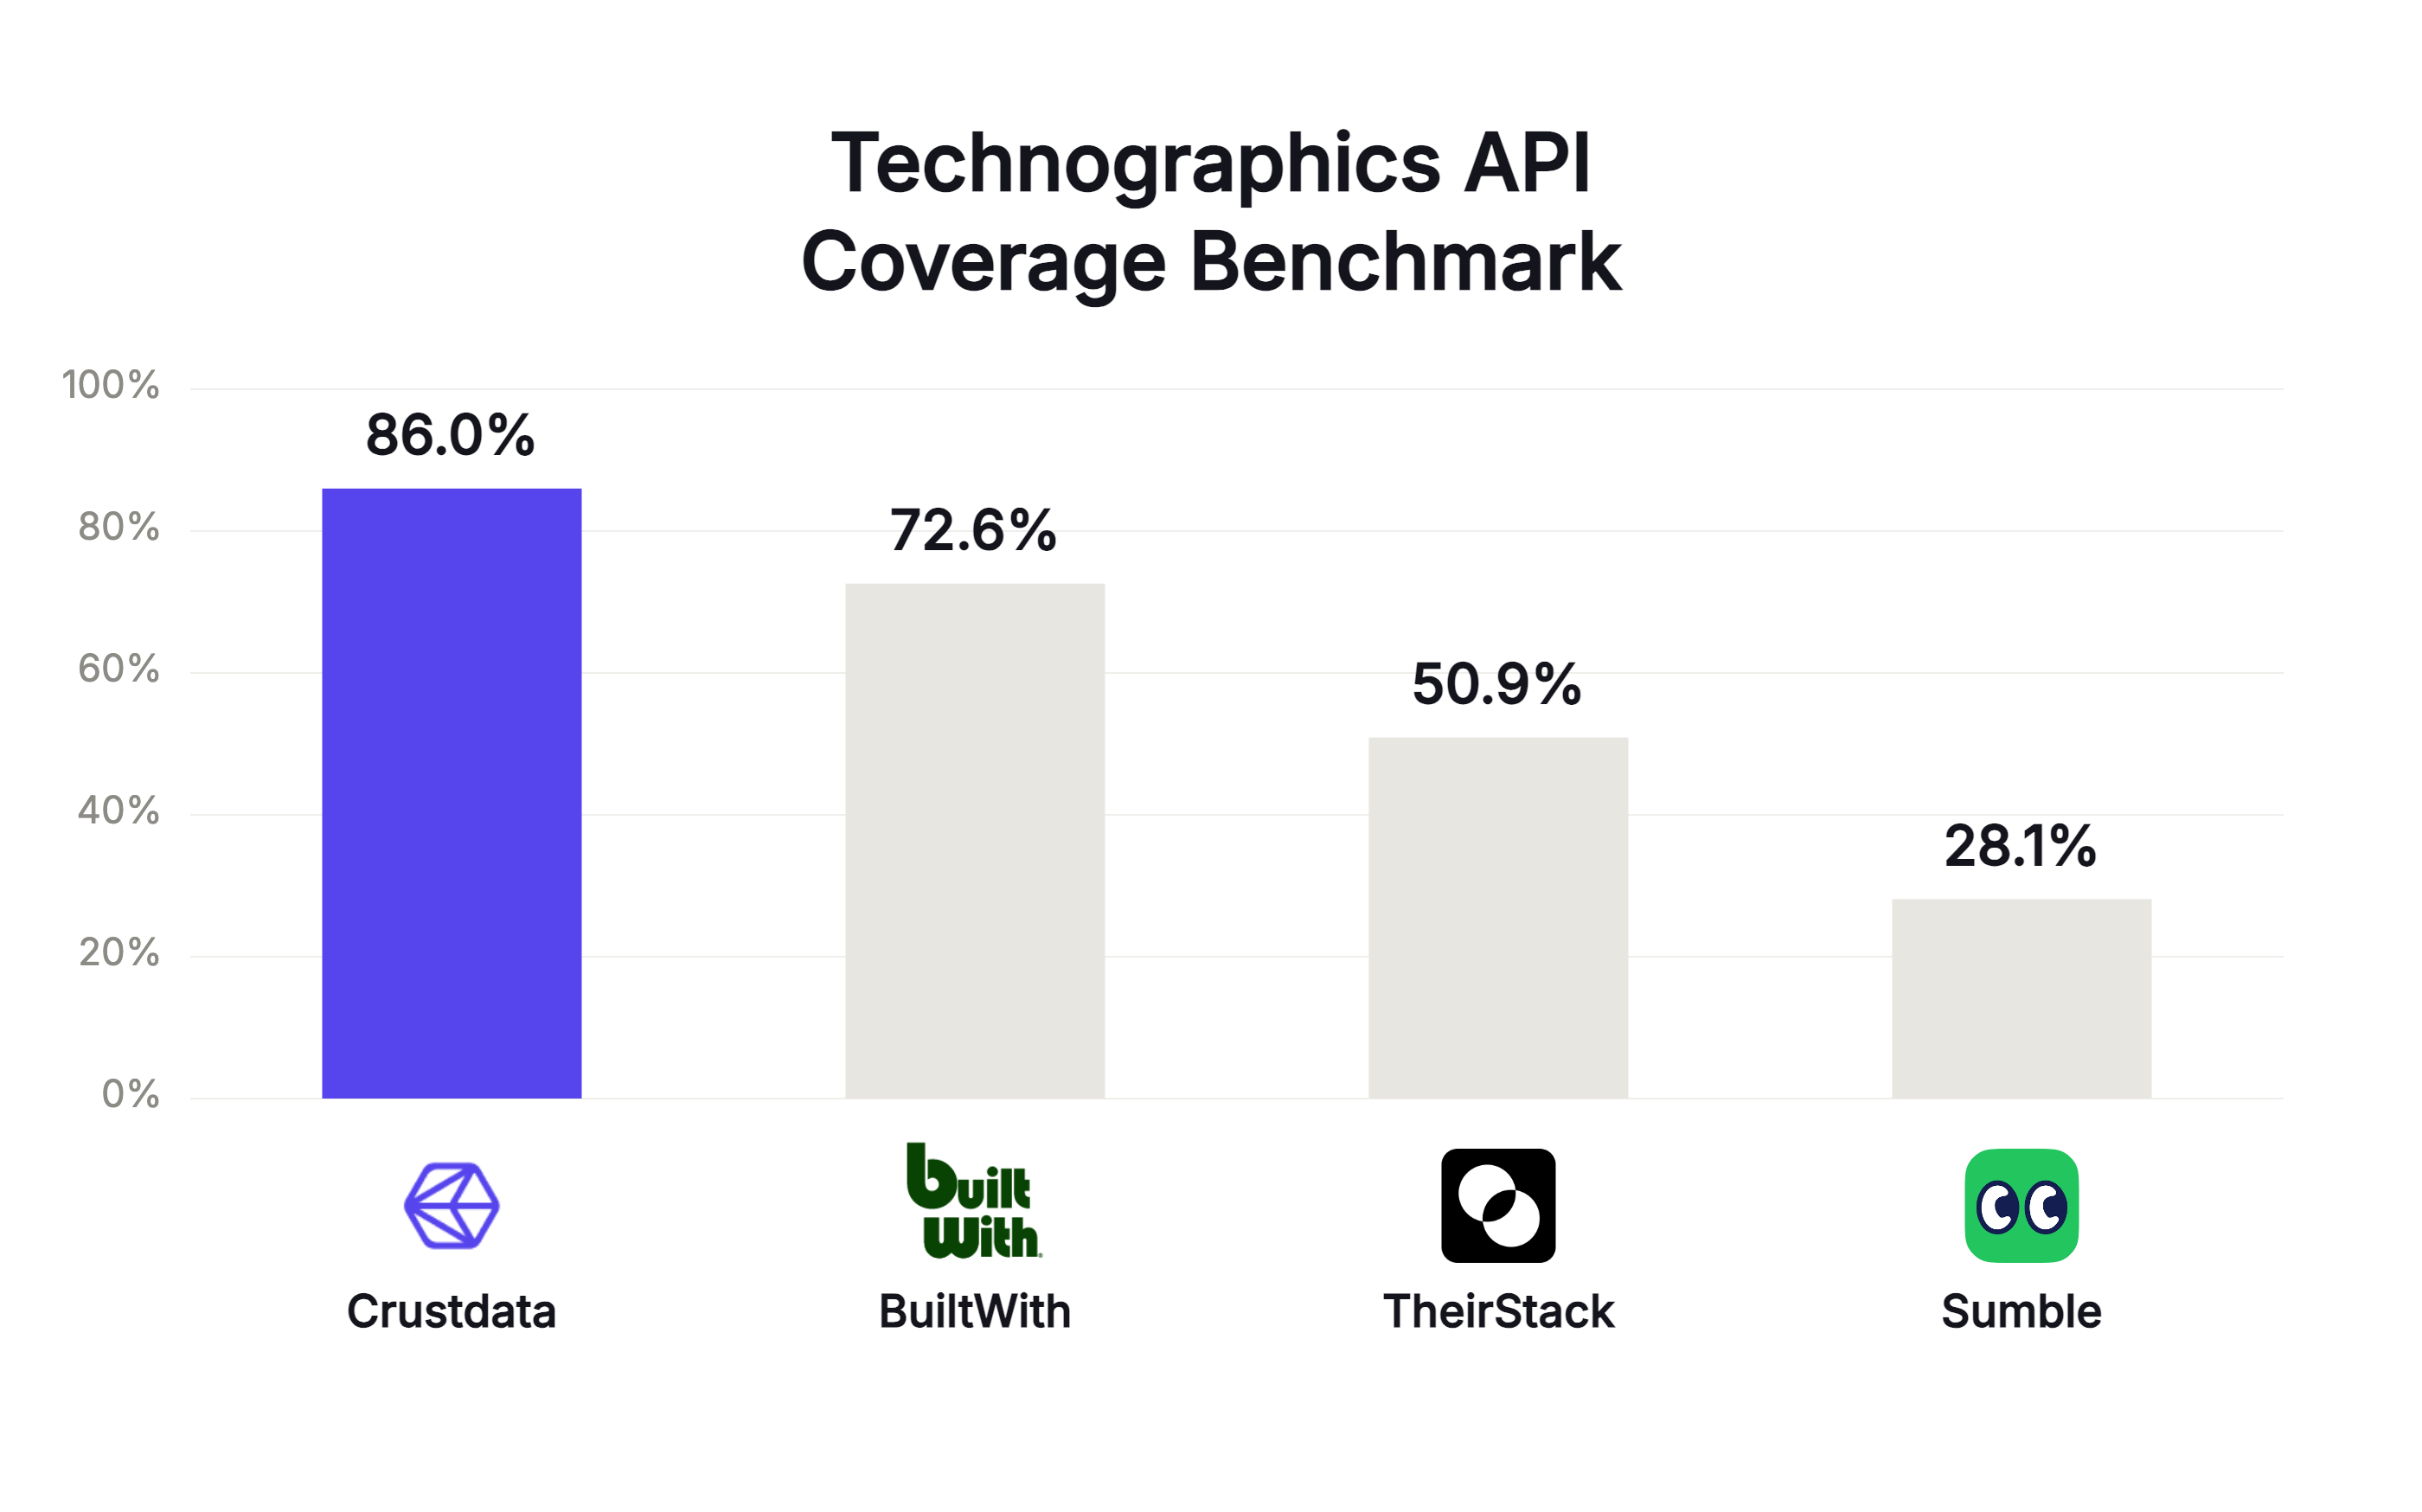
| Segment | Crustdata | BuiltWith | TheirStack | Sumble |
|---|---|---|---|---|
| All 1,004 companies | 86.0% | 72.6% | 50.9% | 28.1% |
| SMB software (401) | 88.5% | 82.0% | 38.6% | 19.9% |
| Mid-size tech (261) | 84.4% | 69.2% | 60.4% | 30.5% |
| Established (342) | 84.3% | 63.8% | 57.5% | 35.8% |
| Last 12 months only, all 1,004 | 97.4% | 81.1% | 36.6% | No dates returned |
BuiltWith is second at 72.6%. It reaches 82.0% on SMB software companies, and falls to 63.8% on established companies. TheirStack on the other hand, 38.6% on SMB software and 60.4% on mid-size tech, because it reads job postings and larger companies post more of them. Crustdata holds 84 to 88% across all three segments because it reads both sources.
How was this technographics benchmark measured?
Each provider received one enrich call per company, for the same 1,004 companies, on the same day. Coverage was then scored against a shared answer key.
- One enrich call per company, per provider, all on the same day.
- 1,004 companies in three segments - 401 SMB software, 261 mid-size tech, 342 established.
- A technology enters the answer key when at least three of the four providers report it.
- Coverage is the share of that answer key a provider returned, scored only on the companies it found.
No single provider was the reference for the answer key. A technology counts only when three of the four providers agree it is there, so the only way to score well is to return what the other providers also confirm.
Why does Crustdata find more of the tech stack?
Crustdata finds more because it reads two sources, live website signals and job postings, while BuiltWith reads only websites and TheirStack and Sumble read only job postings. Each single-source provider misses whatever its one source cannot see.
Salesforce is easy. It sits in the tag on a marketing site and in the "Salesforce admin" job posting, so almost every provider finds it. Workday and an internal LMS are hard. They put no tag on any public page, so a website crawler finds nothing. They surface in hiring instead, because a company has to recruit people who already know them. Crustdata reads both sources, so the internal tools that never touch a public page still show up. Drop either source and coverage falls, which is the swing you see between BuiltWith on SMB companies and BuiltWith on established ones.
How do Crustdata, BuiltWith, TheirStack and Sumble differ beyond coverage?
| Basis | Crustdata | BuiltWith | TheirStack | Sumble |
|---|---|---|---|---|
| Detection sources | Live website signals and job postings | Live website signals only | Job postings only | Job postings only |
| Source evidence | Link to the job posting that produced it | No per-detection source link | None | None |
| Categories | Inline, no extra call | Inline | Inline | Inline |
| Credit cost | Fixed per company | Fixed per company | Fixed per company | One credit per detection, so cost tracks stack size |
| Data timestamps | Yes | Yes | Yes | None returned |
You can verify every detection. When Crustdata reports a company uses Salesforce, the response carries a link to the job posting that asked for a Salesforce admin. BuiltWith returns no link for each detection, and TheirStack and Sumble return no source at all. Crustdata is the only one of the four you can audit back to the evidence.
Recency you can check. Crustdata, BuiltWith and TheirStack all date their detections, so you can filter to recent evidence with any of them. Only Sumble returns no dates, so there is no way to tell whether a Sumble detection came from last quarter or from 2019. Where Crustdata separates is coverage inside that recent window. Scored on detections from the last 12 months, Crustdata returns 97.4%, against 81.1% for BuiltWith and 36.6% for TheirStack.
Predictable cost. Crustdata, BuiltWith and TheirStack charge a flat rate per company, so an account that uses 80 technologies costs the same to enrich as one that uses 8. Sumble charges per technology detected, so the cost tracks the size of each company's stack.
The bottom line on each provider
- Crustdata - highest coverage at 86.0%, the only provider that reads both websites and job postings, and the only one that links each detection to its source. The fit when you need internal tools and evidence you can audit.
- BuiltWith - second at 72.6% and strongest on SMB software at 82.0%, within seven points of Crustdata. If you only enrich smaller software companies with rich public websites, BuiltWith covers most of what you need, and the gap may not be worth switching for.
- TheirStack - 50.9% overall and better on larger companies that post many jobs (60.4% on mid-size tech). Job postings only, with no source link.
- Sumble - lowest at 28.1%, returns no dates or sources, and bills per technology detected, so cost is hard to forecast.
How to benchmark technographics providers yourself
Individual benchmarks don't tell the whole story, and this one scores general coverage, not the specific tools your team sells against. Take 300 accounts from your own CRM, send the same list to all four providers, and score coverage on the technologies you actually filter and sell on.
FAQ
Which technographics provider has the best coverage in 2026? Crustdata, at 86.0% coverage across 1,004 companies, ahead of BuiltWith (72.6%), TheirStack (50.9%) and Sumble (28.1%).
Is BuiltWith or Crustdata better for technographics? Crustdata returns higher coverage overall, 86.0% against 72.6%, and leads in every segment. BuiltWith is closest on SMB software companies at 82.0% because it reads public websites. Crustdata also reads job postings, so it finds internal tools like Workday that never appear on a public page.
How is technographics coverage measured? Coverage is the share of a company's verified tech stack a provider returns. A technology counts as verified when at least three of four providers report it, and each provider is scored only on the companies it found.
Can you see the source behind a technology detection? With Crustdata, yes. Each detection links to the job posting or website signal that produced it and carries the date of that evidence. BuiltWith returns no link for each detection, and TheirStack and Sumble return no source at all.
How much does technographics enrichment cost? Crustdata, BuiltWith and TheirStack charge a flat rate per company, so the cost does not change with the size of the tech stack. Sumble charges per technology detected, so its cost rises for companies with larger stacks.